
18
Jul
Spider charts are used by consultants to compare a clients company to that of their competitors. The chart provides a comparison view of the company’s performance to that of its competitors’ in various areas. The comparison shows the strengths and weaknesses of both companies. This is a great chart to use to help companies decide improvements are needed.
How To Use A Spider Chart
- The first thing you want to do in the Spider Chart is fill in some of the information and then save your work. Then fill in the important details in the chart, such as the title of the chart, the date and fill in the data being surveyed.
- The second thing you want to do is tweak the graph to represent the numbers for each survey category. Then graph the chart to represent each company’s numbers.
- The third thing you want to do is fill in information on the box that is in the lower right of the graph. You’ll want to add the name of each company in the color coded rectangles. On chart type you typed in the name of the type of survey your charting down.
Tips On How To Best Use The Spider Chart
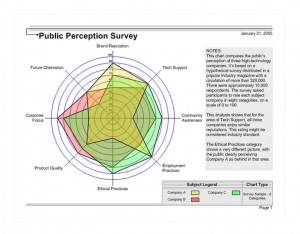
- You first want to decide what type of survey your company needs done. For example, in the Spider Chart the title of the survey is Public Perception Survey. Then you want to add in the graph the different categories that go with public perception. Brand Reputation is one of the categories. What do the numbers show on the company’s brand reputation? Each category is colored coded so that there is not a confusion of what category is being represented.
- Second, after graphing the different categories, the company can then make a better informed decision of how to improve each category based on the numbers compared to those of another company.
- The third thing you want to do is save the data. The Chart can be used again in the near future to compare how the numbers looked back then and how they look now. This will let the company know if the numbers have improve, based on changes made from the original Spider Chart.
The Spider Chart is a good way companies can keep track on what products or services to improve.
Download: Spider Chart
X
Your free template will download in 5 seconds.
Check this out while you wait!
Check this out while you wait!