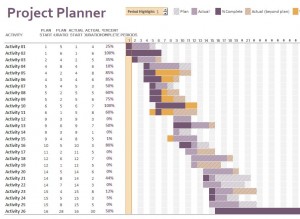
The Microsoft project Gantt chart is designed to help you easily monitor your projects by specific activities through the Gantt chart model. With the Microsoft project Gantt chart template, you can keep track of where each activity related to a project is.
The Microsoft project Gantt chart can be accessed instantly for free by clicking the download link available on this page. Continue reading below for further instructions on how to use the Microsoft project Gantt chart template in your home or office today!
How to Use the Microsoft Project Gantt Chart Template
The Microsoft project Gantt chart template comes as a spreadsheet designed to be used in the Excel program. After downloading and opening the template, immediately save a blank, unused copy so that you’ll have a fresh one at your disposal whenever you may need it.
You’ll notice next to the “Project Planner” title at the top of the document is an explanation of the color-coded system employed by the Microsoft project planner Gantt chart. The color-coded system will display how far along you are in various stages of the project.
As for the chart itself, information is broken down using the following categories:
- Activity
- Plan Start Date
- Actual Start Date
- Actual Duration
- Percent Complete
As designed, the Microsoft project Gantt chart includes space for up to 26 different activities, though this can be modified and adjusted based on the size and scope of your project. Stages of the project are document on a period basis. The template will display how far along a project is by using the aforementioned color-coded system in bar graph form. You can highlight individual periods by using the data selector at the top of the template.
Make project tracking and documentation easier than ever before with the new Microsoft project Gantt chart template. Download the Microsoft project Gantt chart template for free from TemplateHaven.com today!
Download: Microsoft Project Gantt Chart
Check this out while you wait!
